Interpretation of the logger’s graph (using TempCentre software)

Post factum I found out that the effectiveness of the home-built radiation shield was not satisfactory, therefore I will analyse only the intervals when the logger wasn’t exposed to the direct sunshine. This means to skip approximately the 11 AM – 4 PM period (5 AM – 10 AM on the diagram above, because of the 6 hour time difference).
First night (17-18 January)
The temperature was decreasing fast in the evening between 7:13 PM – 9:23 PM, from -19.2 to -30.6 degrees Celsius. After this it was a short warming up to 10:33 PM when it reached -28.0 degrees. Around this time I was outside my tent and have seen no clouds on the sky. Also it was a complete lack of wind at the bottom of the hollow and only ocasionally some mild air movements on the rim. Between 10:33 PM – 1:53 AM the temperature have plummeted fast again and have reached -36.0 degrees, which is the lowest temperature for the entire night. From here to 4:43 AM it was an abrupt and significant warming period when the temperature have climbed to -18.6 degrees. I haven’t observed an appreciable cloud coverage or more than light air movements at my tent in this period too, however as I have watched the sky only a few times, I can’t exclude a temporary altocumulus invasion. I have seen these types of clouds present on the sky, but were always occupying way less then one half of the total part. After 5:13 AM the temperature have decreased fast again and have reached a secondary minimum of -33.0 degrees at 9:53 AM. I was present at the bottom of the hollow from around 8:30 AM until some minutes after 9 AM and have seen the sky partially covered by cirrus and thin altocumulus clouds. On the graph there is a short warming of 1-2 degrees which coincides exactly with the period when I was there and have checked the logger, so this lil temperature change was probably caused by my influence. Shortly after 9 AM I left the depression and have returned only in 21 January in the afternoon.
Second night (18-19 January)
The graph’s curve plummeted to -33.4 degrees Celsius at 7 PM. This will remain the lowest temperature for the entire night, as from here starts a considerable and long warming period with more abrupt fluctuations, reaching a maximum of -20.0 degrees at 6:23 AM. Then the temperature decreases fast until 8:43 AM when it reaches a secondary minimum of -32.4 degrees. The following short warming increases the temperature to -26.5 degrees at 9:33 AM, but then plummets back to -31.3 degrees at 10:53 AM. Around this time reaches the sunshine first the bowl’s bottom, therefore the 10:43-10:53 period always marks the start of an abrupt temperature rising (valid for all research days).
These first 2 nights have a less regular temperature curve with some striking and considerable warming sections. As I haven’t observed any semnificative cloud coverage (outside cirrostratus) in this period, I suspect that the major cause of these abrupt night fluctuations are rather air movements/ mixing than overcasting. My residence in Erdenekhairkhan was quite close to the research camp (less than 20 km in direct line) so even in the days when I wasn’t present I could appreciate pretty well the general conditions of the sky above.
Third night (19-20 January)
In the afternoon the temperature started an abrupt drop which continues into the late evening when it reaches -39.5 degrees at 10:43 PM, the lowest temperature for the entire night. From here the curve became atypical but without semnificative changings, fluctuating between -36.5 degrees and -39.3 degrees during the entire night period.
Fourth night (20-21 January)
In the late afternoon and early evening hours the temperature decreases abruptly to -36.1 degrees at 7:13 PM. From there is a one hour intense warming to -31.3 degrees than the temperature will start to fall again and (with some smaller fluctuations) will reach a minimum of -43.8 degrees at 8:53 AM, the lowest for this night.
Fifth night (21-22 January)
After 3 PM I reached the frost hollow’s bottom again.
In the morning of 21 the sky was partially covered by cirrus clouds and this setting will continue to define the entire day. From the afternoon to the early evening there is an abrupt drop when the temperature reaches -40.9 degrees at 7:43 PM. Then follows a significant 1.5 hours warming when it climbs to -31.3 degrees at 9:13 PM. That’s almost 10 degrees. Shortly afterwards the drop continues again and reaches the lowest temperature of this night at 5:43 AM: -46.7 degrees Celsius. From there the curve is atypical but with smaller fluctuations, remaining in the morning hours between -44.7 and -45.9 degrees. I was present at the hollow’s bottom during the morning between 8:40 and 9:45 AM and I was checking the logger just before leaving. This coincides exactly with the sharp leap on the graph when the temperature rises to -37.9 degrees at 9:43 AM. This peaky segment was definetely caused by my intervention. In the morning the sky was partially covered by cirrus and cirrostratus clouds. In the night before I haven’t observed clouds at any time when I was outside my tent. (Note: Thin cirrus clouds are not visible at night, especially without moon.) I had left the camp on this day after 11:30 AM and will return here 2 days later, in the afternoon of 24 January.
Sixth night (22-23 January)
From the afternoon there is a very abrupt and significant decreasing of the temperature up to 1:13 AM when it will reach -49.5 degrees, the night’s minimum. From here the night’s curve became atypical but without big differences, fluctuating between -46.5 and -48.4 degrees in the second part of the night, respectively the morning hours.
Seventh night (23-24 January)
After 3:43 PM the temperature starts to drop abruptly and continues to drop quite strong even in the middle and second part of the night. I consider this night curve the closest to the ideal one between all 8 cases. At the same time it had also reached the absolute lowest temperature of the entire research period: -53.0 degrees at 8:33 AM. Outside 21 January it is the single day when the minimum temperature was registered in the dawn period, when a night minimum normally is expected to occur.

Eighth (last) night (24-25 January)
This day was the clearest and also the calmest between all eight days, therefore the temperature curves are the most representative for a frost hollow in ideal conditions. I have not seen any clouds on the sky during the entire day, not even thin cirruses. The night was full of stars, without any air movement. The sharp temperature drop what started in the afternoon continued until the first part of the night when at 1:53 AM have reached the night’s minimum, -50.3 degrees. From here there will be very small changes during the remaining part of the night and the following morning hours. This part of the graph is close to an isotherm. As the highest registered value between 12 AM and 10 AM was -48.9 degrees, the 10 hour amplitude is only 1.4 degrees.
At dawn, when I visited the hollow for the last time, there were some cirrus clouds on the sky. I was present in the depression approximately between 8:45 AM and 10:05 AM. The very last measurement of the logger was influenced certainly by my intervention as I have checked the logger before stopping the entire research activity, so this -42.7 degrees can be excluded from the graph. According to the logger the lowest air temperature what I have personally experienced is -49.8 degrees and it was happening at 9:03 AM, 9:13 AM and 9:33 AM during this last research day.
General conclusions
– The formation of the inversion layer starts just after the place gets into shade and evolves extremely fast in the first 2-3 hours, than the procedure slows down considerably.
– Both the formation and the destruction of the inversion layer takes place in a very short time.
– The formed inversion layer can be easily destroyed during the evening/ night by temporary clouding or mild wind.
– Only 3 out of the 8 night minimums were recorded after 2 AM (but the absolute lowest one is between these 3).
– The temperature decrease is the strongest between 4 PM – 5 PM.
– The temperature increase is the strongest between 11 AM – 12 AM.
– The cooling period has a much longer curve than the warming period, even so the first section of the cooling period’s curve is the same (or more) steep than the first part of the warming period’s curve.
Comparing my logger’s results with the lowest temperatures measured in Mongolia and the World during the same period
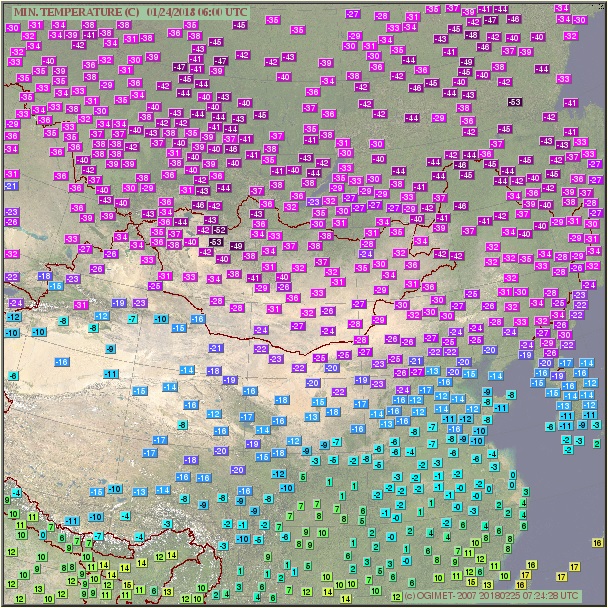
At the weather forecast center in Ulaanbaatar I found out that the coldest temperature in this winter in entire Mongolia was measured in 24 January at Tsetsen Uul and it’s -53.2 degrees Celsius. This value is almost the same with my logger’s absolute minimum (-53.0 degrees) which was registered in the same day. Outside Erdenekhairkhan, Tsetsen Uul is the closest station to my research camp (around 55 km’s in straight line) and it’s also situated at a similar elevation. The snow cover’s thickness during this period was 16 cm there, which is also very similar with the snow conditions at the frost hollow’s bottom, what I approximated to be around 15 cm. Because of it’s slightly convex topography, Erdenekhairkhan reached only -35 degrees on this coldest day. The next lowest temperature is -51.8 degrees, recorded at Bayantes (Gandan Huryee station) three days later in 27 January (the minimum on 24 was -51.7 degrees). Tes from the famous Uvs lake’s basin and Tosontsengel from Zavkhan aimag reached -50 degrees, Otgon and Zuungobi around -48 degrees.

Actually (according to the statistics found on Ogimet) there is only a single station in the entire world, which recorded a lower minimum temperature in 24 January than Tsetsen Uul and my frost hollow. It’s Toko from southern Yakutia with -53.4 degrees Celsius, a very subtle difference. The next closest is Summit station from the middle of Greenland’s ice sheet with -52.2 degrees. Verkhoyansk recorded -43.4 degrees on this day, Ojmjakon even less as the weather was snowy.
Comparing the measurements of the 3 instruments
During my visits to the frost hollow’s bottom I made some instant temperature measurements with the precision electronic device and also checked the minimum thermometer’s index and alcohol column (keeping both around the same height with the logger). I made some pictures of these measurements which I can compare with the logger’s recordings at the closest time marks.
In 18 January in the morning the minimum thermometer’s index was stopped at -38.5 degrees Celsius. Meanwhile the logger have registered only -36.0 degrees. This will remain the biggest difference between the two devices until the end of the research. As in the first night the loggers mounting permitted more contact between the device and the shield’s interior, I think the difference was intensified by too much isolation on the logger’s side. Therefore I changed the loggers positioning inside the mounting the next day to have the least possible contact between the device and the surrounding material. I also raised a little the uppermost part of the shield to enhance the ventilation.
I consider this change have altered a little the daily temperature recordings as the logger’s uppermost part received some sunshine during certain parts of the day. I made this sacrifice because the night minimum’s accuracy was my first priority.
In 22 January in the morning I found the minimum thermometer’s index stopped at -47.3 degrees Celsius, while the logger registered a night minimum of -46.7 degrees. The difference is much smaller than the previous time (0.6 degrees vs 2.5 degrees), so I consider the changing in the mounting an useful intervention. In this morning I have a picture with my electronic device showing -46.4 degrees at 8:58 AM. The two measurements of the logger taken the closest to this minute are -45.5 and -45.6 degrees. That’s around one degree difference.

In 25 January in the morning I found the minimum thermometer’s index stopped at -52.2 degrees Celsius, while the logger registered a minimum of -50.3 degrees. This is again a bigger difference (1.9 degrees) between the two and it can’t be caused by the mounting. From this morning I have pictures of the electronic device showing -50.7 and -50.5 degrees at 9:00 AM, respectively 9:07 AM. Meanwhile the logger recorded -49.5 and -49.8 degrees Celsius. That’s again the same one degree difference. During this time the minimum thermometer’s alcohol column was showing between -51.5 and -52.0 degrees. This is another one degree difference in the opposite direction of the precision device’s measurement. As this more than one degree difference between the two devices remained constant after the last research day (the alcohol thermometer shows 1-1.5 degrees lower values even at room temperature), I consider the minimum thermometer lost his previous accuracy, when the two instruments had the difference around or less than half degree.
As the digital precision device is the most accurate between the 3 instruments (+-0.1 degrees), I will try to approximate the real absolute minimum of the 8 day research period. Since the electronic device was always measuring around one degree lower temperatures than the logger, in my opinion this value is around -54 degrees Celsius, exceeding even the coldest temperature registered at a mongolian weather station (Tsetsen Uul) in this winter. This corrected value also exceeds the coldest temperature recorded in the entire world in 24 January 2018 (Toko, Russia: -53.4 degrees Celsius) and approaches the absolute lowest temperature measured in Mongolia by around one and a half degrees (the -55.6 degrees Celsius recorded at Zuungobi).
Definitely a successfull journey and a productive research.

This is what we call ‘adventure’!
A very nice analysis of your fieldtrip to a beautiful country. I hope you can go back and enjoy all the aspects of Mongolia and maybe next time you already have a new cold record.
Thank you, Karel!
Meanwhile I’ll also try to experience/ record other kind of climate extremes.
Thanks for sharing your experience! I really enjoyed this trilogy from your trip to Mongolia and I’m looking forward to your next topo-climatological adventure.
Best regards from Switzerland, Stephan
Glad to hear this Stephan. Especially as we share the same passion. Have a frosty spring.
Gratulálok, Zsombor! Nagyon érdekesek a cikkek, és nagyon érdekes maga a kutatási terület. Számomra, mint hőmérsékleti szélsőségek iránt érdeklődőnek, különösen.
Azt szeretném kérdezni, hogy mi a véleménye a nem hivatalos mongol hideg rekordról, ami -56 °C (tizedesek nélkül) 1972. december 31-én, az Uvsz-tónál.
Illetve ajánlanék egy, a fentihez viszonylag közel fekvő területet, ahol érdemes lenne méréseket végezni. Az alábbi Weather Underground cikk foglalkozik vele részletesen:
https://maps.wunderground.com/blog/weatherhistorian/comment.html?entrynum=116
Kösz szépen, Balázs.
A bizonyos -56-os adat (amit néha -58-nak írnak el) minden bizonnyal a -55.6-os érték kerekített formája. Züüngobi településről van szó, az Uvsz tó medencéjéből (habár elég távol van magától a tótól). Ez a hivatalos mongóliai hideg-rekord.
Orlovka -62-es értéke meglehetősen gyanús számomra. Léteznek hasonló szélességi fokon található, magasabban fekvő, ugyanakkor szintén hegyek által körülzárt medencék úgy az Altáj mint a Hangáj hegység belsejében (mongol és orosz területeken) és egyelőre sehol sem közelítette meg a hőmérséklet a -60 fokos értéket. A mongóliai Otgon, Tsetsen Uul és Tosontsengel településeken -53, -55 fok közötti értékeket regisztráltak több alkalommal is.
A tádzsik Bulunkul településről írják még, hogy -63 fokot is mértek volna. Habár ez a helyszín jóval délebbre van innen, de sokkal magasabban is fekszik. Véleményem szerint ez az adat sem lehet igazán hiteles.
Hello , first of all many thanks for sharing your extraordinary adventure and my compliment for your report and courage to facing alone the extreme conditions of those remote lands.
In my job I also monitor the frost hollows of Venetian Alps (since 2005) and I was very interested about your research in Mongolia. I have a questions: given that the lowest temperature in Mongolia throughout the winter was -53.2°C, in Tsetsen Uul (among the official weather stations, not in a frost hollow) I expected much lower temperatures inside “your” depressions. But maybe Tsetsen Uul area is colder than the one you have monitored…
Thank you, Bruno. I heard about you and your team’s extensive work in the Italian mountains. Certainly one of the best studies in the domain, worldwide.
Your observation regarding the Mongolian minimums is well founded. I can give you a detailed explanation about my conclusions, if you are interested.
The short answer is: Western Mongolia as a whole is comporting like a gigantic frost hollow (centered in the Uvs Lake’s basin), therefore a significant temperature difference between an actual frost hollow (doline-like) and a flat valley bottom under similar circumstances (same latitude, same elevation, same snow cover) it’s unlikely in my opinion.